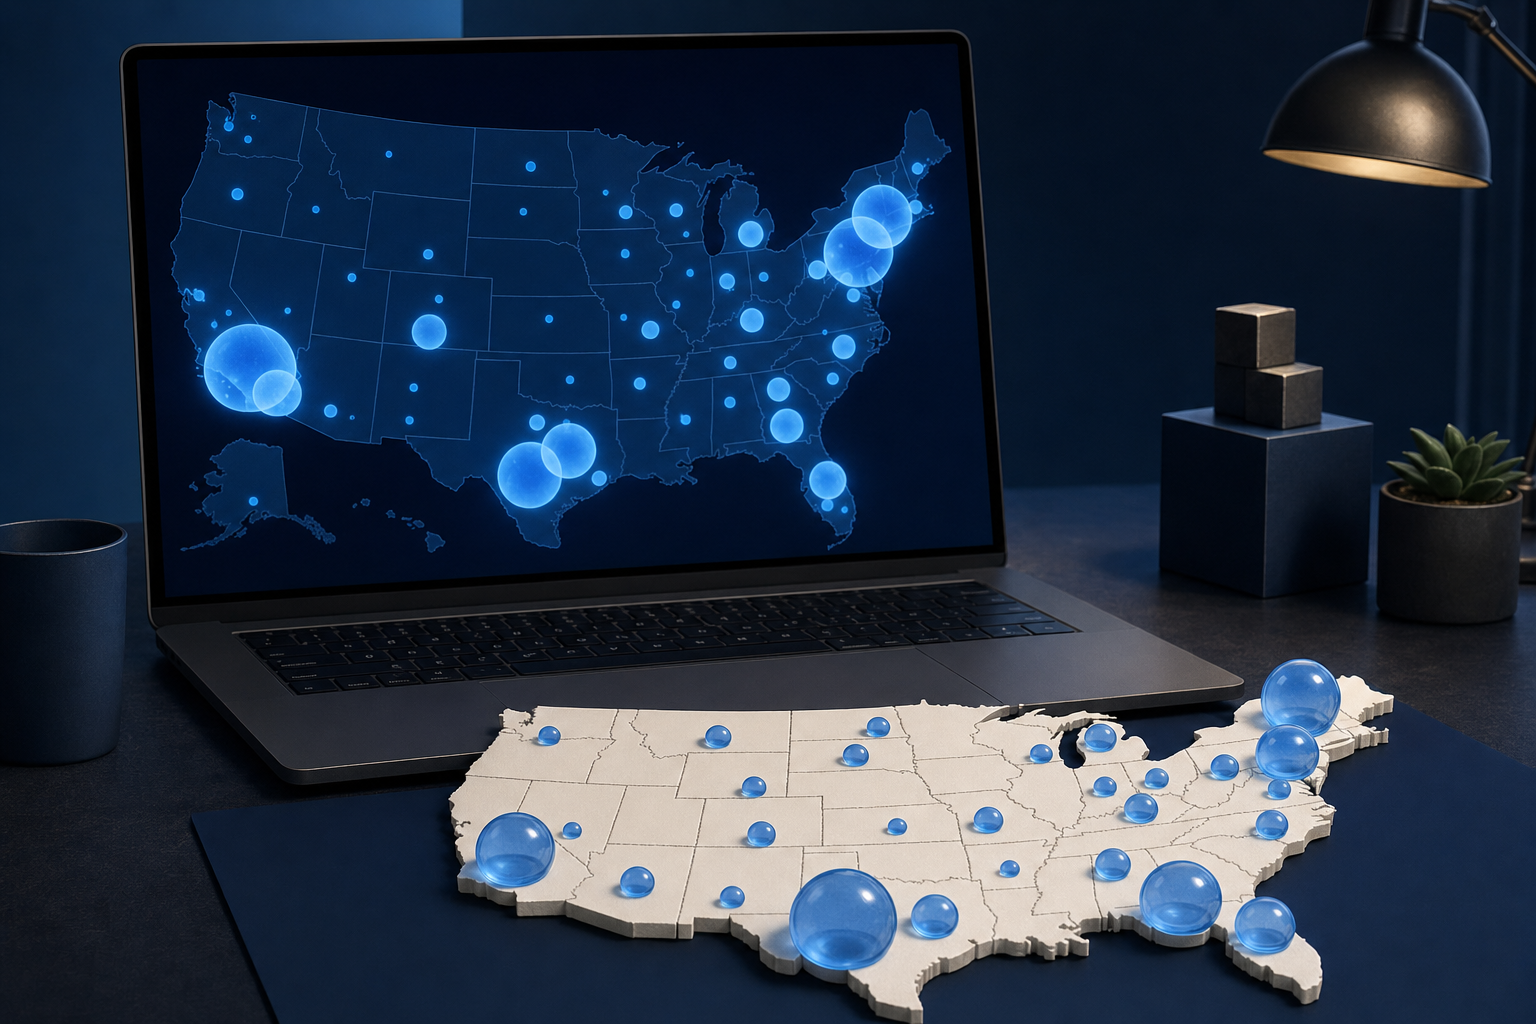
For small businesses that ship products, understanding where customers are concentrated can be a challenge. Traditional reports often require grouping sales by city or region or exporting data to spreadsheets for further analysis. This can be time-consuming and may obscure valuable geographic insights. Shopify’s new bubble maps feature in Analytics addresses this problem by visually representing sales hotspots directly within the platform.
Key takeaway: Shopify’s bubble maps group nearby shipping or billing addresses into visual bubbles sized by metrics like total sales or order count, allowing merchants to quickly identify geographic sales concentrations. This insight supports smarter decisions about inventory placement, fulfillment strategies, and regional marketing efforts.
What Are Bubble Maps in Shopify Analytics?
Bubble maps are a new visualization tool in Shopify Analytics that display clusters of sales based on shipping or billing addresses. Instead of listing sales by city or region in tables, bubble maps aggregate nearby addresses into bubbles whose size corresponds to a chosen metric such as order volume or total sales value. Users can zoom, pan, and click on bubbles to drill down into specific areas, making the data more interactive and easier to interpret.
Benefits for Small Businesses
Small businesses often face constraints in managing inventory and marketing budgets. Bubble maps provide a straightforward way to:
- Identify sales hotspots: Quickly see where most orders originate without manual data manipulation.
- Optimize inventory placement: Decide which warehouses or fulfillment centers should stock more products based on geographic demand.
- Target regional marketing: Focus advertising and promotions in areas with higher sales potential.
By integrating these insights directly into Shopify’s Analytics dashboard, merchants save time and reduce reliance on external tools.
How to Access and Use Bubble Maps
To start using bubble maps, merchants can open the new “Order hotspots by shipping location” report within Shopify Analytics or add the Shipping address or Billing address fields to any existing report. The bubble maps are available in both reports and dashboard cards for users with access to Analytics. This seamless integration means merchants can incorporate geographic sales insights into their regular data review workflows.

Worked example (illustrative)
Scenario: A small business selling handmade candles ships nationwide and wants to optimize their inventory and marketing.
Inputs:
- Sales data with shipping addresses from the past quarter.
- Metrics selected: total sales value per location.
Process: The merchant opens the “Order hotspots by shipping location” report in Shopify Analytics and views the bubble map. They notice large bubbles in the Pacific Northwest and smaller clusters in the Southeast.
Expected output: Visual identification of sales hotspots, with the largest bubbles indicating where most sales occur.
Decision: The merchant decides to stock more inventory in a fulfillment center near the Pacific Northwest to speed delivery and launches a targeted social media campaign in the Southeast to grow that market.
Exception: If the business has many international orders, bubbles may cluster densely in certain countries, requiring zooming or filtering to analyze effectively.
What to do next
If you run a Shopify store that ships physical products, open your Shopify Analytics dashboard and explore the new bubble maps feature today. Start by viewing the “Order hotspots by shipping location” report to identify key sales regions. Use these insights to evaluate your current inventory distribution and marketing focus. Consider adjusting fulfillment strategies or launching localized promotions based on the geographic sales patterns you discover.
Sources and editorial notes
This article is based on the Shopify Changelog post titled “Find your sales hotspots with bubble maps in Shopify Analytics” available at https://changelog.shopify.com/posts/find-your-sales-hotspots-with-bubble-maps-in-shopify-analytics. The source supports the description of bubble maps, their availability, and business use cases. The worked example and recommendations are editorial suggestions by AutoSmallBiz and have not been tested with actual customer data.












Leave a Reply